Main concept
This website presents our methodology and our results for the characterization of urban Wi-Fi access points in the context of Smart Cities. We base our analysis on a clustering algorithm aimed at discovering cities areas from the connections of mobile users to the available Wi-Fi access points in cities. This work is essential to improve spatial context sensing in Smart Cities. This is particularly helpful in the field of recommendation systems and for other decisions making issues, for example to propose new relevant urban venues, and facilities according to the citizens' visitation habits.
OUR ANALYSIS
The analyzed data was provided by the Afone Group, a virtual operator based in Angers, France, which deployed Wifilib --- meaning free Wi-Fi --- a continuous Wi-Fi network in the busiest areas of different cities in France . Our data is collected from this network.
Our approach is to use spectral clustering method to discover local urban areas from the connections of mobile users to an urban Wi-Fi network. Spectral methods for data clustering have been the subject of active research and are widely used in practice since they allow to obtain good quality clusters. Works in this field include Livehood which uses Foursquare check-ins to compute spectral clustering for categorizing venues in the city. In our case, we won't consider this Location Based Social Network (LBSN) but lever our analysis from the existence of the city-wide free public Wi-Fi network Wifilib deployed over the busiest areas of several French cities. The resulting Wi-Fi connection traces are a very rich source of data from which location of users can be studied by applying clustering algorithms to infer virtual districts in the city described by the mobility patterns of the users visiting them.
REAL WORLD RESULTS
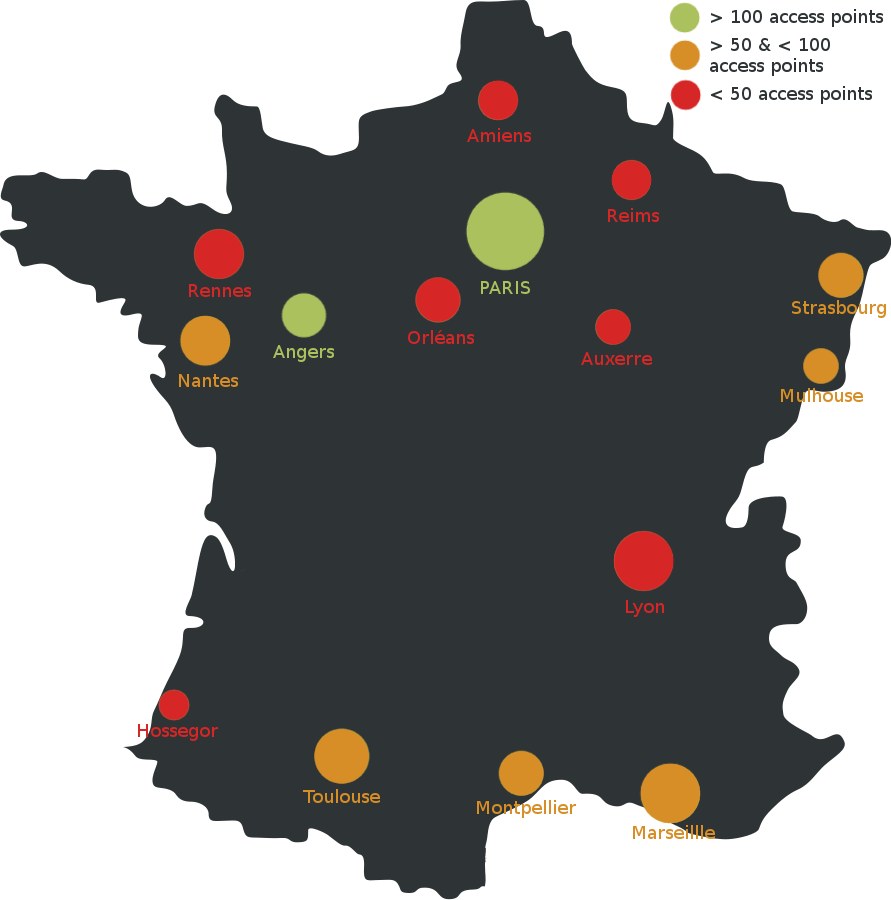
We have analyzed the connections to 2200 Wi-Fi access points in 15 cities in France. In 2017 this represented a total of 55 000 000 visits (connections) for almost 1 500 000 users. All results were compared for vilidation to the way the inhabitants of the city feel about the relevance of the deduced areas.
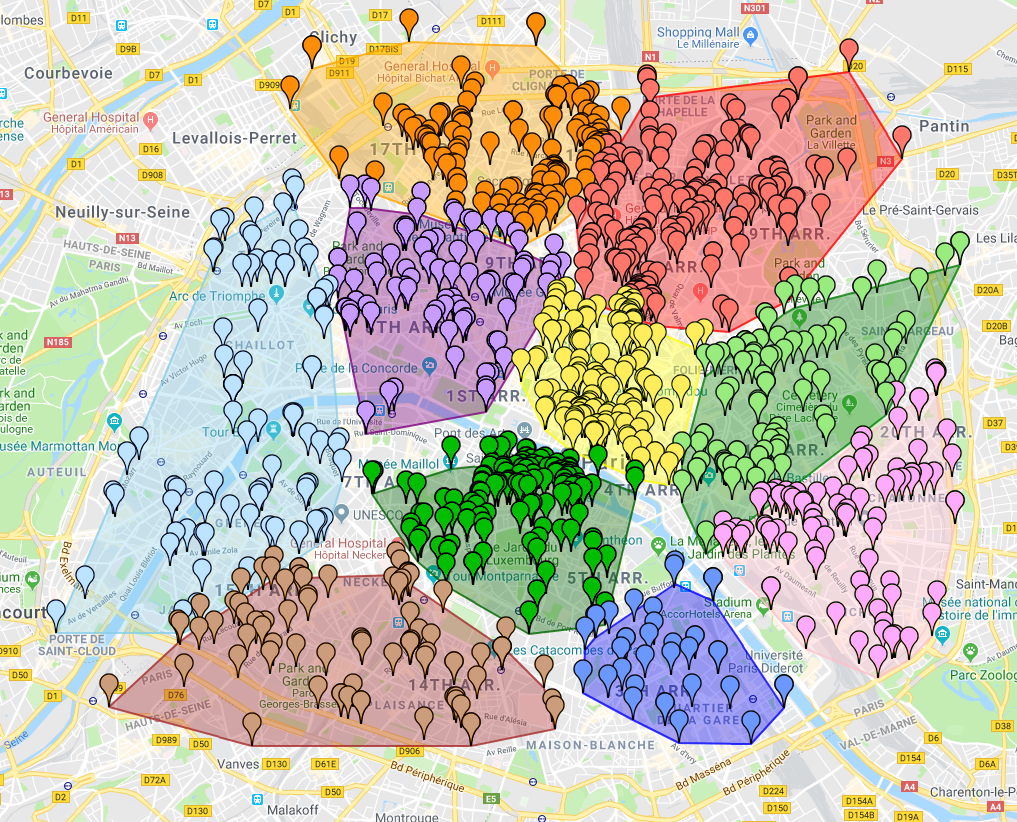
Paris represents the biggest source of data : 1188 access points, 26 185 277 connections by 915 921 users. The second most important city is Angers. It corresponds to 219 access points, 15 139 162 connections by 79 153 users. Other cities are classified using two ranges : ‹ 100 access points, and ‹ 100 access points and › 50 access points.
In the cities of Paris and Angers, we benefit from the high number of available access points , users and connections which allow to deduce very precise cluster results. However, even though computed clusters for the cities of Marseille, Strasbourg, Nantes, Mulhouse and Montpellier remain relevant, the small number of clusters obtained from the connections to a relatively low number of access points in those cities is not sufficient to cover the entire city. Finally, even though results for cities having very few access points (‹ 50) can be considered as a good starting point since we obtain relevant areas. However, in order to reduce the area that is not classified as being part of a cluster we would need to consider the connections of users to a larger number of access points.
You can go through our results city by city using the map of France below. It can be centered by clicking on the orange button below.
Click on a city to observe its results
MIDDLE-EARTH (MDLE) RESULTS
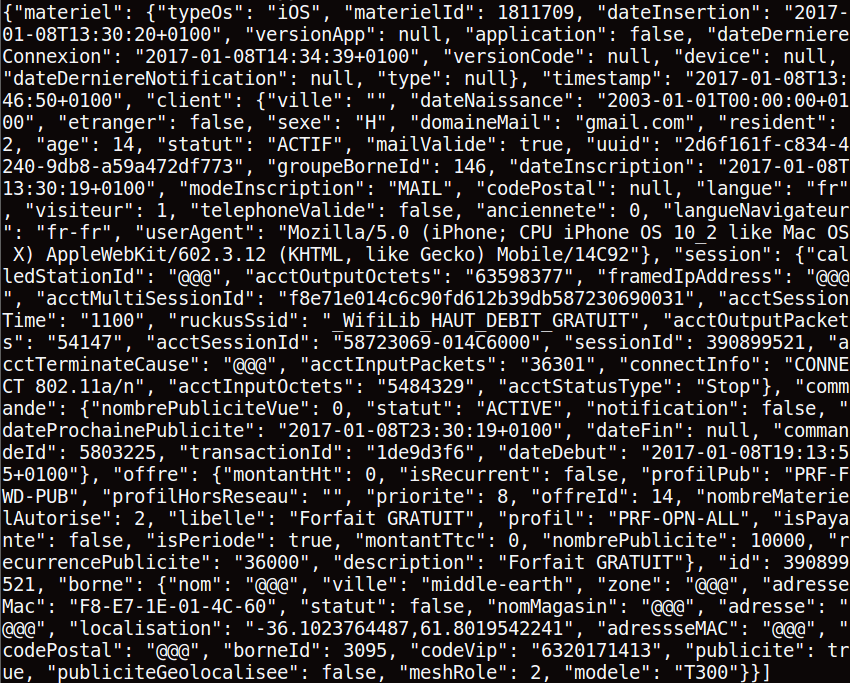
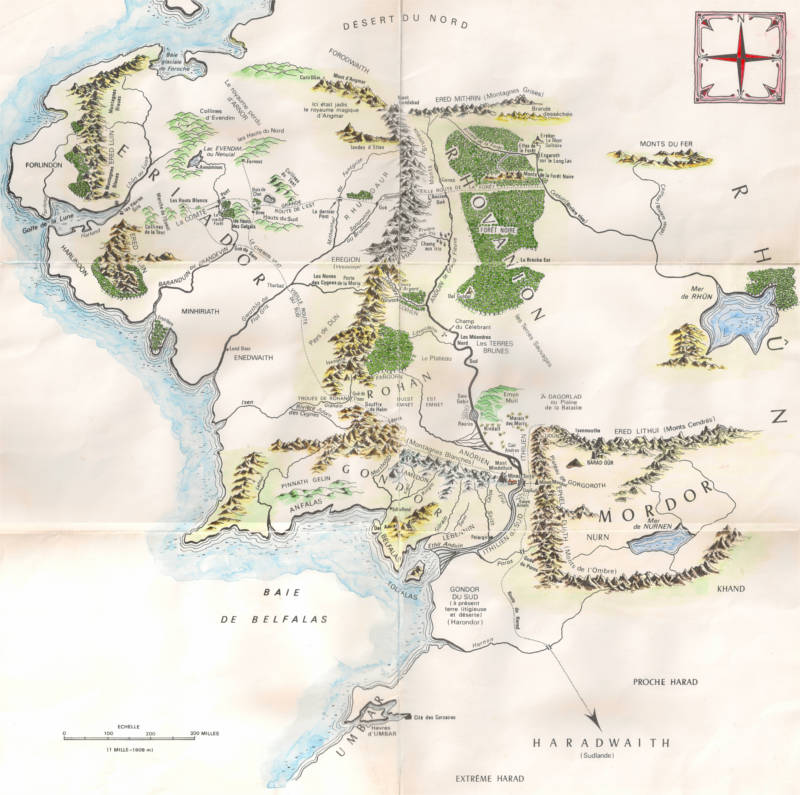
Since the real world datasets are private, we can't share them as they stand. Nevertheless, it is important to provide our peers with the possibility of working on a full anonymized sample in order to experiment our method, improve it, or propose another one. Thus, first, we have built a one month consistent anonymized dataset sample of the real world in a given city for which we have kept all real: access points, connections and users together. Items which needed to be changed were those that can inform people of real world locations and thus reveal the observed city and the mobility of its inhabitants. Hence, we have replaced those information by '@@@'. Nevertheless, the GPS coordinates of the access points were tranposed to corresponding locations in the Lord of The Rings Middle-Earth (MDLE) for which we have made sure to keep the original consistency. Note that in our case we consider MDLE as a full-fledge planet with latitudes from -90° to 90°, longitudes from -180° to 180° and radius of 468627 meters.
Second, in order to highlight the relevancy of using a clustering algoritm, we have created a second sample on which MDLE locations were shuffled (random). From this noisy dataset that we consider as control, we expect to find no consistency of further discovered areas.
Finally, we applied our clustering algorithm to both samples which results can be observed by clicking on the corresponding buttons below.
DOWNLOADS
This section allows peers to download the two samples described above along with their metadata descriptions : MDLE DATASET with correct projected locations, and MDLE DATASET with shuffled locations (SF-LOC). We also provide a blank HTML MDLE map file in order for people to display their computed results (using colored markers for access points and polygons for areas). Furthermore, since our method needs to consider the geographic distance between access points, we also provide a csv file with the original real world distances between every pair of access point.
Advices : The most important data to consider in order to compute spectral clustering is the user's id ("uuid"), the access point location ("localisation"), the access point id ("bornId") and the connection timestamp ("timestamp").
Note that the following files : HTML MDLE map, metadata descriptions, and original locations distances are also available for downaload (see below) as a zip archive.